Enroll Now
☆
Enroll Now ☆
Weekly Charts
Each Sunday, receive Weekly Chart ideas with my personal levels of support and resistance. The 8.99 option gives you access to Discord (limited to 80 members). The 5.99 option only gives you access to the Weekly Chart Ideas via the website and newsletter (no Discord access).
***** Example of the format I share with trigger levels and selling targets 🎯*****
Chart #2 $QCOM: Qualcomm
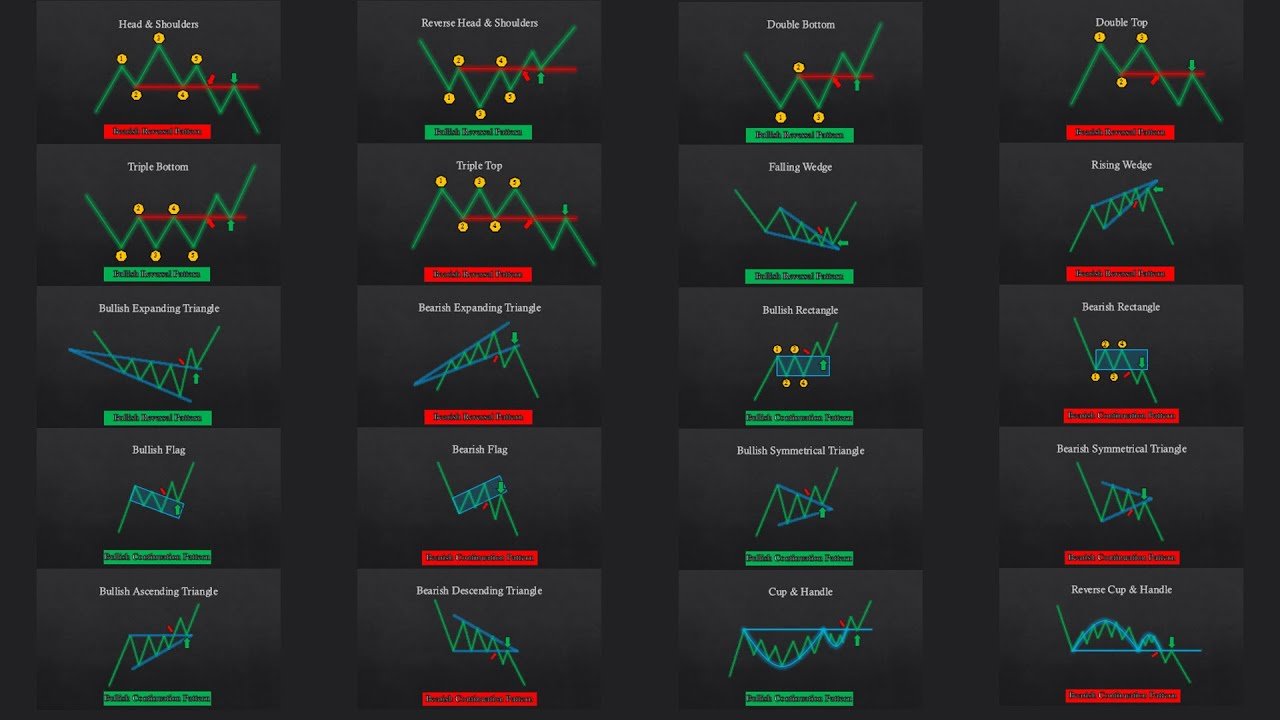
Chart Pattern: Symmetrical Wedge within a Massive Weekly Wedge
I’ve been watching this for a couple weeks. I believe the big move has not occurred yet. It has endured repeated rejections of the breakout at the 50 ema. How much can it endure? We will see our answer early in the week as it is now very near support at the trend line. The high wick rejected breakout we saw on Thursday tells me this has more downside ahead of it but I’ve never been reward for making predictions. Instead, I will be watching for confirmation at the support and resistance levels I’ve shown in white. My targets are the purple lines. I also want to point out I use “The 4 S” rule when I’m trading these. It allows me to maximize gains, minimize losses, and stay in a winning trade as long as possible.
> 112 = 113 Calls
< 108 = 107 Puts


